 咨询热线:400-065-6886
咨询热线:400-065-6886
咨询热线:400-065-6886
导
读
一
数据处理
1. 读取数据
In [1]:
df = read.table('phylum.taxon.Abundance.xls',header = T,row.names = 1,check.names = F,quote = '',sep = ' ',fill=T)
df
Out[1]:
H12 H13 H14 H2 H4 H6 L1 L2 L3 L5 L6 L7 Abundance superkingdom
Firmicutes 14086 18126 14060 16672 16119 17002 17304 21807 16080 14370 20457 14720 307226 Bacteria
Bacteroidetes 12122 7975 11161 9901 9650 7228 9212 2282 11035 8783 6190 7443 152524 Bacteria
Candidatus_Saccharibacteria 1230 935 1625 290 1410 2727 797 2621 295 3956 758 4248 27716 Bacteria
Actinobacteria 220 602 517 394 352 589 443 920 259 249 345 1209 8101 Bacteria
Unassigned 103 87 208 476 290 145 115 251 190 516 76 202 4195 Bacteria
Proteobacteria 143 173 248 47 36 202 25 23 42 11 76 81 2137 Bacteria
Deferribacteres 0 0 0 1 0 0 8 0 1 0 0 0 27 Bacteria
Tenericutes 0 3 85 122 47 11 0 0 1 19 1 1 336 Bacteri

								a
Cyanobacteria/Chloroplast 0 0 0 1 0 0 0 0 1 0 1 0 6 Bacteria
Verrucomicrobia 0 2 0 0 0 0 0 0 0 0 0 0 3 Bacteria
Spirochaetes 0 1 0 0 0 0 0 0 0 0 0 0 1 Bacteria
All 27904 27904 27904 27904 27904 27904 27904 27904 27904 27904 27904 27904 502272
row=grep('All',rownames(df))rowcol=grep('Abundance',colnames(df))coldf = as.matrix(df[1:row-1,1:col-1])df H12 H13 H14 H2 H4 H6 L1 L2 L3 L5 L6 L7Firmicutes 14086 18126 14060 16672 16119 17002 17304 21807 16080 14370 20457 14720Bacteroidetes 12122 7975 11161 9901 9650 7228 9212 2282 11035 8783 6190 7443Candidatus_Saccharibacteria 1230 935 1625 290 1410 2727 797 2621 295 3956 758 4248Actinobacteria 220 602 517 394 352 589 443 920 259 249 345 1209Unassigned 103 87 208 476 290 145 115 251 190 516 76 202Proteobacteria 143 173 248 47 36 202 25 23 42 11 76 81Deferribacteres 0 0 0 1 0 0 8 0 1 0 0 0Tenericutes 0 3 85 122 47 11 0 0 1 19 1 1Cyanobacteria/Chloroplast 0 0 0 1 0 0 0 0 1 0 1 0Verrucomicrobia 0 2 0 0 0 0 0 0 0 0 0 0Spirochaetes 0 1 0 0 0 0 0 0 0 0 0 0二
barplot绘图
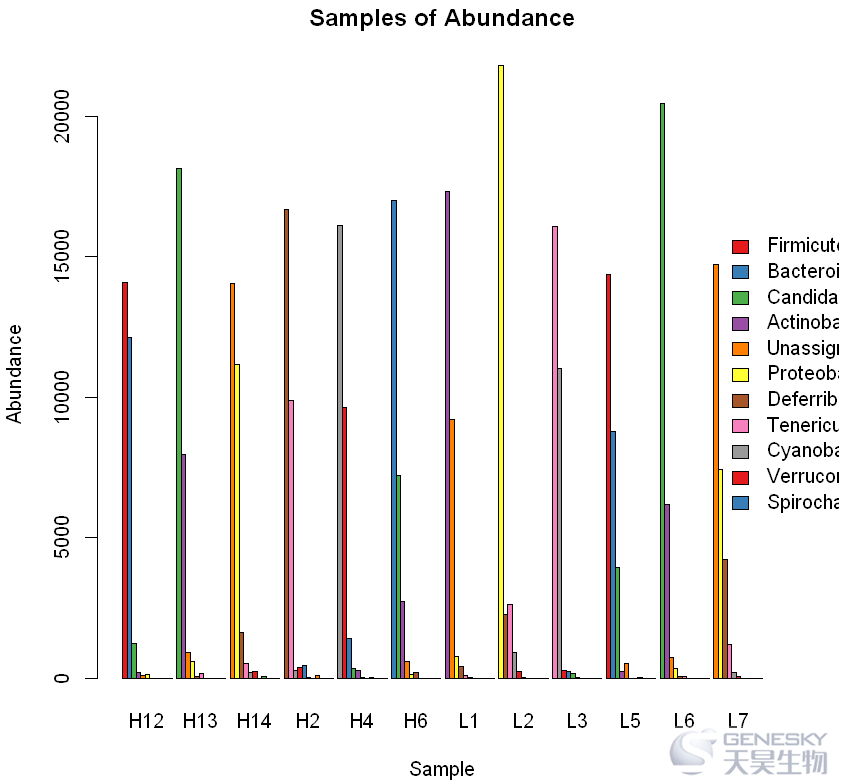
barplot(df,width=0.7,beside = T,col=col,legend=rownames(df),main='Samples of Abundance',ylab='Abundance',xlab='Sample',args.legend = list(x="right",bty="n",inset=-0.4,cex=1))
In [7]:
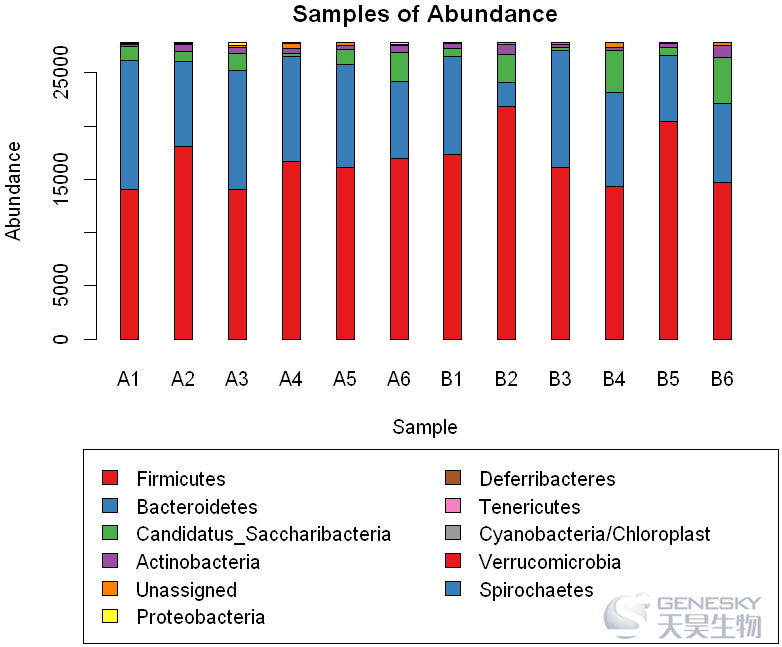
barplot(df,width=0.7,beside =F,col=col,main='Samples of Abundance',ylab='Abundance',xlab='Sample'
legend=rownames(df),args.legend = list(x="right",bty="n",inset=-0.4,cex=1))
Out[7]:
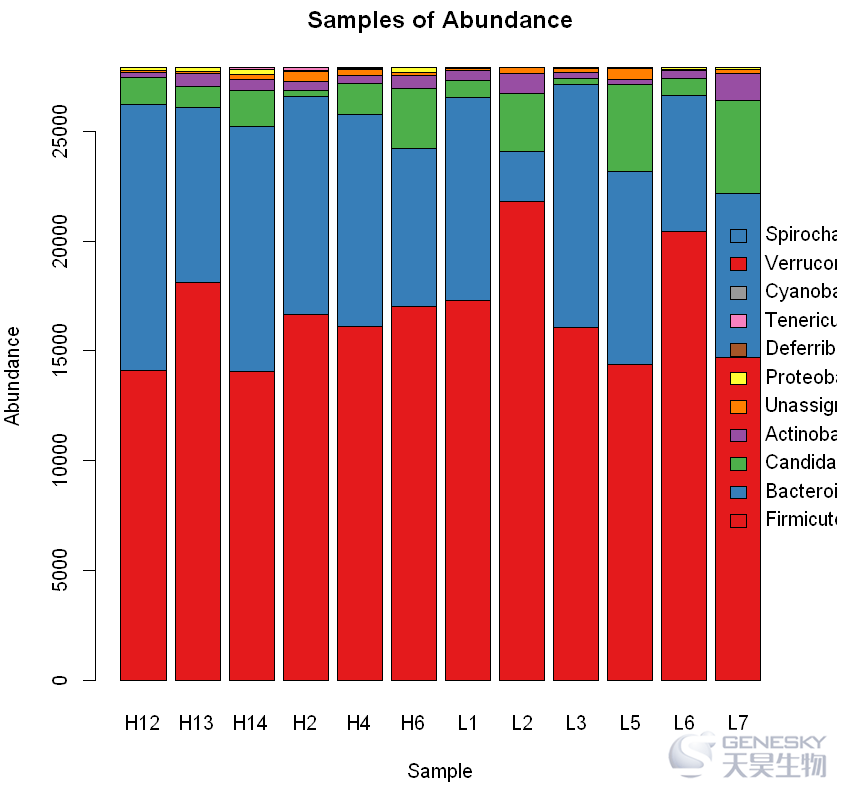
无论是并列式条形图还是堆叠式条形图,标签显示不太好,我们推荐单独调用legend 函数
3. 图例调整
主要参数解释:
par(mai = c(4,0.5,0.5,0.5)) 设置预留大小,本次标签放在图片下面,所以下面预留设置为4
par('usr')获取图片的x轴起始、x轴终止、y轴起始、y轴终止位置
legend参数详解:
x,y为绘制图例的位置,xinch,yinch是位移的大小,legend是要添加的标签
xpd = T 设置为T时显示图例
ncol= 2 设置列数
In [8]:
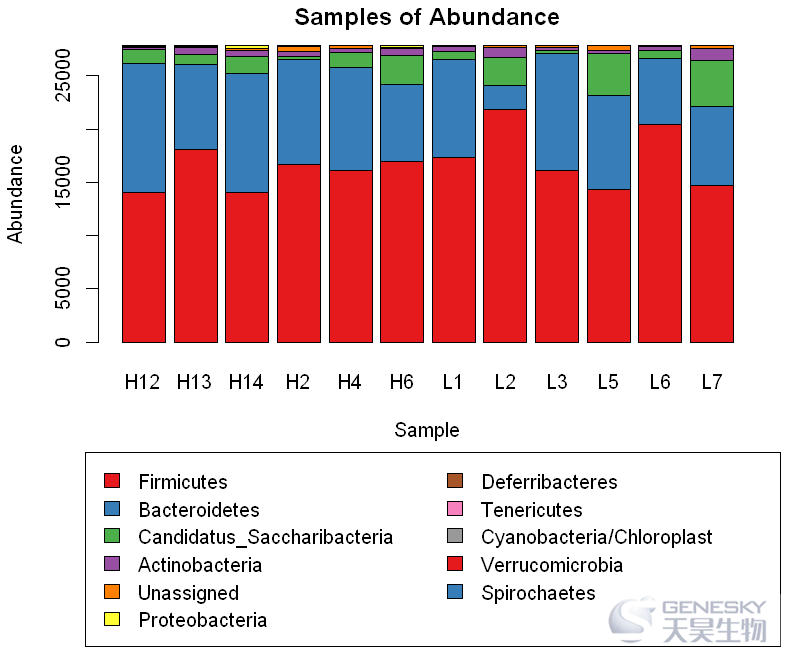
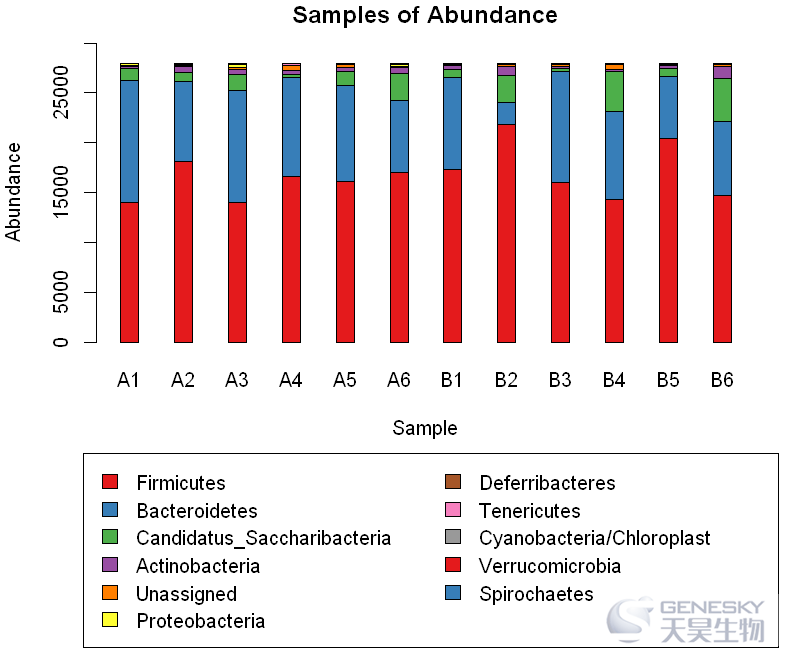
par(mai = c(4,1,0.5,0.5))
barplot(df,width=0.7,beside =F,col=col,main='Samples of Abundance',ylab='Abundance',xlab='Sample')
xy = par('usr')
legend(x=xy[1]-xinch(0.1),y=xy[1]-yinch(0.8),legend = rownames(df),col=col,fill =col,xpd = T,ncol=2)
Out[8]:
4. Barplot参数调整
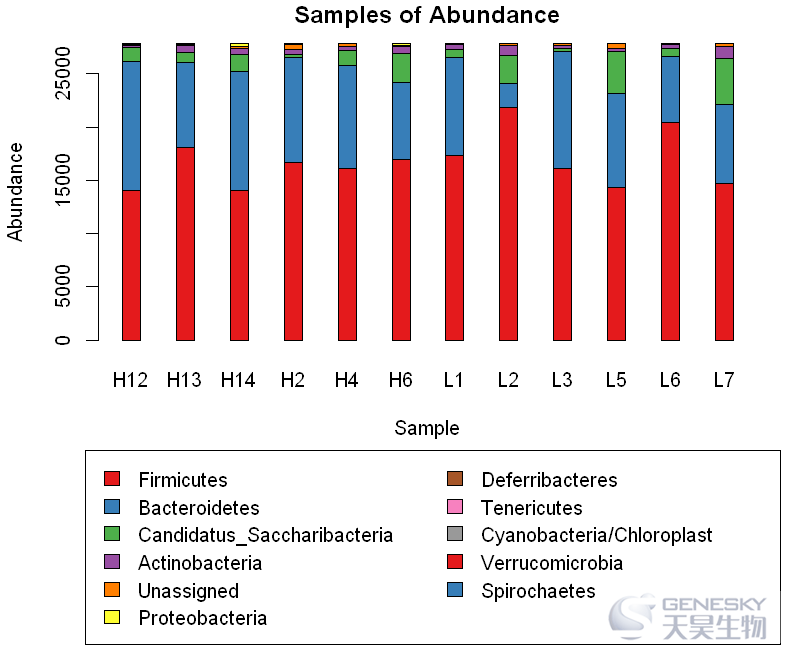
● space调节间隔
In [9]:
barplot(df,width=0.7,beside =F,col=col,space = 2,main='Samples of Abundance',ylab='Abundance',xlab='Sample')
xy = par('usr')
legend(x=xy[1]-xinch(0.1),y=xy[1]-yinch(0.8),legend = rownames(df),col=col,fill =col,xpd = T,ncol=2)
Out[9]:
● names.arg 修改名称
In [10]:
names=c('A1','A2','A3','A4','A5','A6',
'B1','B2','B3','B4','B5','B6')
In [11]:
par(mai = c(4,1,0.5,0.5))
barplot(df,width=0.7,beside =F,col=col,space = 2,names.arg=names,
main='Samples of Abundance',ylab='Abundance',xlab='Sample')
xy = par('usr')
legend(x=xy[1]-xinch(0.1),y=xy[1]-yinch(0.8),legend = rownames(df),col=col,fill =col,xpd = T,ncol=2)
Out[11]:
● 设置y轴坐标
In [12]:
par(mai = c(4,1,0.5,0.5))
barplot(df,width=0.7,beside =F,col=col,space = 2,names.arg=names,ylim = c(0,30000),
main='Samples of Abundance',ylab='Abundance',xlab='Sample')
xy = par('usr')
legend(x=xy[1]-xinch(0.1),y=xy[1]-yinch(0.8),legend = rownames(df),col=col,fill =col,xpd = T,ncol=2)
Out[12]:
三
ggplot2作图命令
1.加载R包和数据格式处理
In [13]:
library(ggplot2)
library(reshape2)
In [14]:
df1<-melt(df) ####对数据格式进行转化
colnames(df1)<-c("phylum","Sample","Abundance")
df1[sample(rownames(df1),10),] #随机显示10行df1数据
Out[14]:
phylum Sample Abundance
30 Tenericutes H14 85
27 Unassigned H14 208
123 Bacteroidetes L7 7443
53 Cyanobacteria/Chloroplast H4 0
8 Tenericutes H12 0
66 Spirochaetes H6 0
88 Spirochaetes L2 0
89 Firmicutes L3 16080
16 Unassigned H13 87
31 Cyanobacteria/Chloroplast H14 0
2. 并列式条形图与堆叠式条形图
position="dodge" or position="stack"
In [15]:
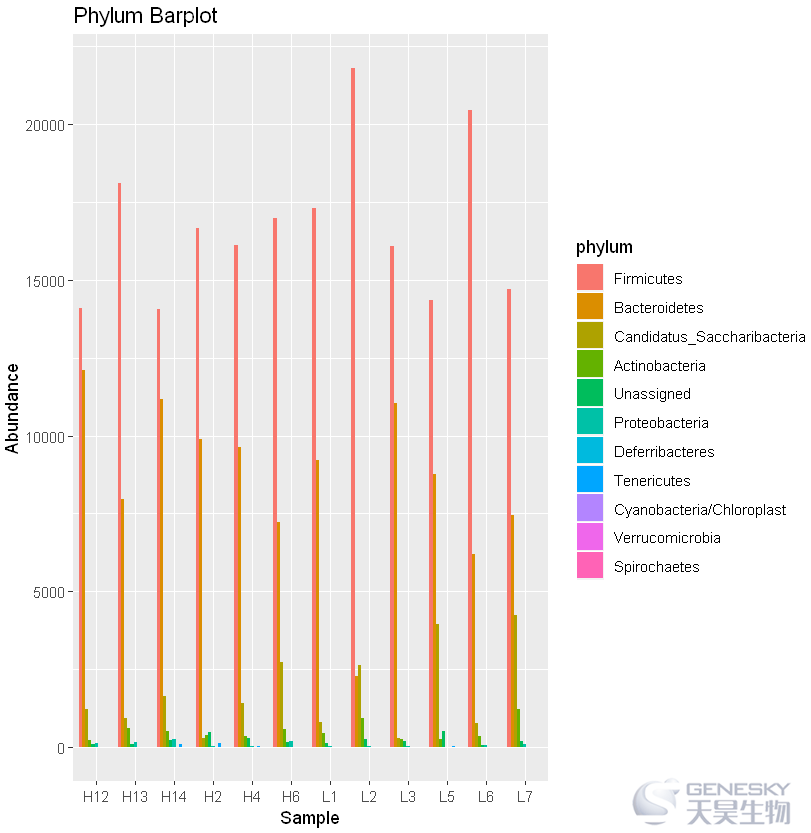
ggplot(df1,aes(x=Sample,y=Abundance,fill=phylum))+geom_bar(stat="identity",position="dodge")+
ggtitle("Phylum Barplot")+theme()
Out[15]:
In [16]:
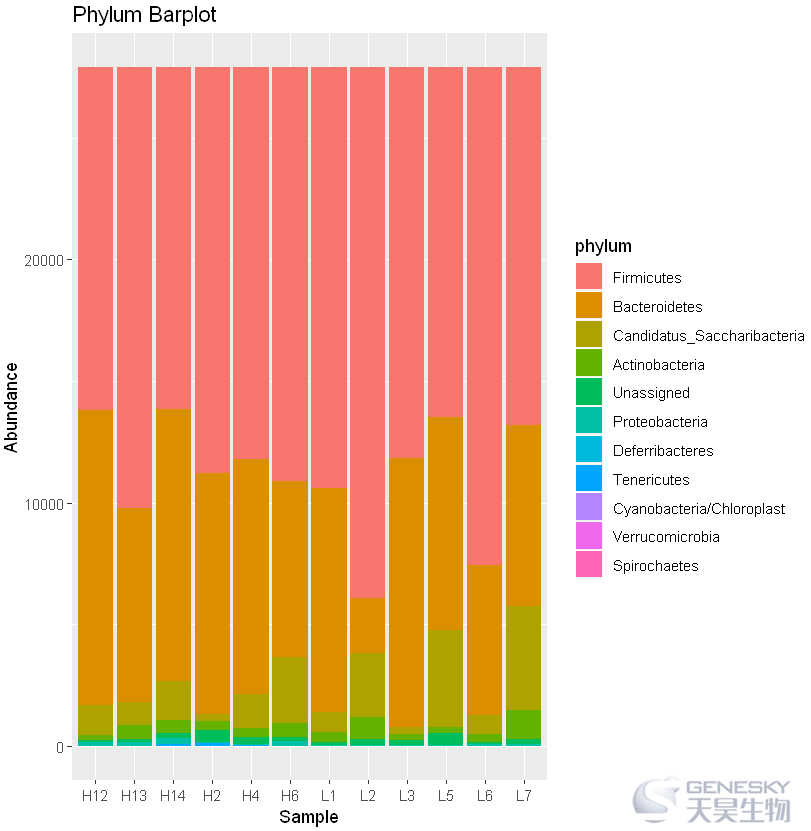
ggplot(df1,aes(x=Sample,y=Abundance,fill=phylum))+geom_bar(stat="identity",position="stack")+
ggtitle("Phylum Barplot")+theme()
Out[16]:
3. theme调整标题、文字、背景等
theme 参数使用示
theme(axis.title.x=element_text(size=15),axis.title.y=element_text
(size=15),plot.title=element_text(size=20,hjust=0.5),
plot.background=element_rect(fill="lightblue"),legend.background=element_rect
(fill="lightgrey"))
In [17]:
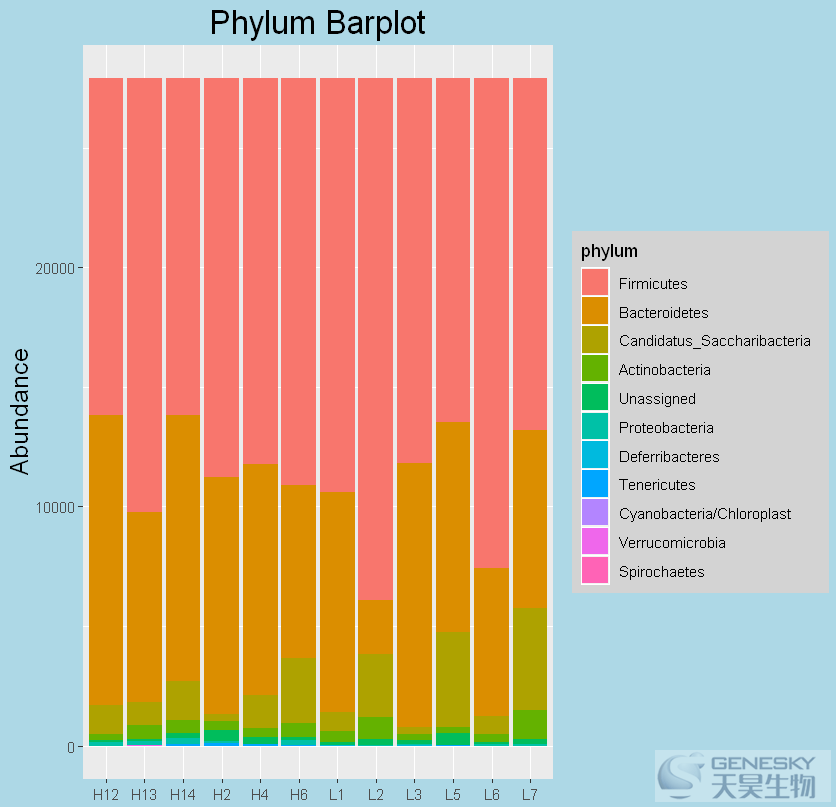
ggplot(df1,aes(x=Sample,y=Abundance,fill=phylum))+geom_bar(stat="identity",position="stack")+
ggtitle("PhylumBarplot")+theme(axis.title.x=element_text(size=15),axis.title.y=element_text(size=15),plot.title=element_text(size=20,hjust=0.5),
plot.background=element_rect(fill="lightblue"),legend.background=element_rect(fill="lightgrey"))
Out[17]:
划重点
往期链接:
【零基础学绘图】之绘制heatmap图(三);
20分钟搞定GEO上传,史上最简单、最详细的GEO数据上传攻略;
【零基础学绘图】之绘制PCA图(二);
【零基础学绘图】之alpha指数箱体图绘制(一);
如果您对本文案介绍的方法或代码有疑问,
请扫码添加QQ群沟通
【本群将为大家提供】
分享生信分析方案
提供数据素材及分析软件支持
定期开展生信分析线上讲座

QQ号:1040471849
作者:大熊
审核:有才
来源:天昊生信团

创新基因科技,成就科学梦想
微信扫一扫
关注该公众号


前往“发现”-“看一看”浏览“朋友在看”